Flourpedia.com - Equipment below
is to measure the resistance and extensibility of dough mixing. The glutomatic
test measures the amount of gluten protein in wheat or flour. The farinograph
test measures the resistance of a dough against the mixing action of paddles
(blades). The extensograph test measures the resistance of dough to stretching.
The alveograph test measures the resistance of a bubble of dough to expansion.
Glutomatic
Wet gluten content is determined by washing the flour or ground wheat sample
with a salt solution to remove the starch and other solubles from the sample.
The residue remaining after washing is the wet gluten.
During centrifugation,
the gluten is forced through a sieve. The percentage of gluten remaining on the
sieve is defined as the Gluten Index, which is an indication of gluten
strength. A high gluten index indicates strong gluten.
Wet gluten content
results are expressed as a percentage on a 14% moisture basis; for example, 35%
for high protein, strong gluten wheat or 23% for low protein, weak gluten
wheat.
The wet gluten test provides information on the quantity and estimates
the quality of gluten in wheat or flour samples.
Gluten is responsible for the
elasticity and extensibility characteristics of flour dough. Wet gluten reflects
protein content and is a common flour specification required by end-users in
the food industry.
Farinograph
The farinograph determines dough and gluten properties of a flour sample
by measuring the resistance of a dough against the mixing action of paddles
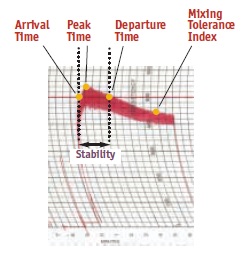
(blades). Farinograph results include absorption, arrival time, stability time,
peak time, departure time, and mixing tolerance index. Farinograph curves are
described below :
 |
| Weak gluten Flour |
 |
| Strong Gluten Flour |
The Farinograph Test is one of the most commonly used flour quality
tests in the world. The results are used as parameters in formulation to
estimate the amount of water required to make a dough, to evaluate the effects
of ingredients on mixing properties, to evaluate flour blending requirements, and
to check flour uniformity. The results are also used to predict processing effects,
including mixing requirements for dough development, tolerance to over mixing,
and dough consistency during production. Farinograph results are also useful
for predicting finished product texture characteristics. For example, strong
dough mixing properties are related to firm product texture.
The Farinograph Test measures and records the resistance of a
dough to mixing with paddles.
- Absorption is the amount of water required to center the farinograph curve on the 500-Brabender Unit (BU) line. This relates to the amount of water needed for a flour to be optimally processed into end products. Absorption is expressed as a percentage.
- Peak Time indicates dough development time, beginning the moment water is added until the dough reaches maximum consistency. This gives an indication of optimum mixing time under standardized conditions. Peak time is expressed in minutes.
- Arrival Time is the time when the top of the curve touches the 500-BU line. This indicates the rate of flour hydration (the rate at which the water is taken up by the flour). Arrival time is expressed in minutes.
- Departure Time is the time when the top of the curve leaves the 500-BU line This indicates the time when the dough is beginning to break down and is an indication of dough consistency during processing. Departure time is expressed in minutes.
- Stability Time is the difference in time between arrival time and departure time. This indicates the time the dough maintains maximum consistency and is a good indication of dough strength. Stability time is expressed in minutes
- Mixing Tolerance Index (MTI) is the difference in BU value at the top of the curve at peak time and the value at the top of the curve 5 minutes after the peak. This indicates the degree of softening during mixing. Mixing tolerance index is expressed in minutes Weak gluten flour has a lower water absorption and shorter stability time than strong gluten flour.
Extensograph
The extensograph determines the resistance and extensibility of a
dough by measuring the force required to stretch the dough with a hook until it
breaks. Extensograph results include resistance to extension, extensibility,
and area under the curve.
Resistance to extension is a measure of dough
strength. A higher resistance to extension requires more force to stretch the
dough. Extensibility indicates the amount of elasticity in the dough and its
ability to stretch without breaking. Extensograph curves are described below :
 |
| Weak Gluten Flour |
 |
| Strong Gluten Flour |
Results from the Extensograph Test are useful in determining the
gluten strength and bread-making characteristics of flour. The effect of
fermentation time and additives on dough performance can also be evaluated.
The Extensigraph Test measures and records the resistance of a
dough to stretching.
- Resistance to Extension is the R value and is indicated by the maximum height of the curve. It is expressed in centimeters (cc), Brabender units (BU), or Extensigraph units (EU).
- Extensibility is the E value and is indicated by the length of the curve. It is expressed in millimeters (mm) or centimeters (cm).
- R/E Ratio indicates the balance between dough strength (resistance to extension) and the extent to which the dough can be stretched before breaking (extensibility).
- Area Under the Curve is a combination of resistance and extensibility. It is expressed in square centimeters (cm2). Weak gluten flour has a lower resistance to extension (R value) than strong
- gluten flour.
Alveograph
The alveograph determines the gluten strength of a dough by measuring the
force required to blow and break a bubble of dough. The results include P
Value, L Value, and W Value. A stronger dough requires more force to blow and
break the bubble (higher P value).
A bigger bubble means the dough can stretch
to a very thin membrane before breaking. A bigger bubble indicates the dough
has higher extensibility, that is, its ability to stretch before breaking (L
value). A bigger bubble requires more force and will have a greater area under the
curve (W value). Alveograph curves are described below :
 |
| Weak Gluten Flour |
 |
| Strong Gluten Flour |
The Alveograph Test provides results that are common specifications used
by flour millers and processors to ensure a more consistent process and product.
The alveograph is well suited for measuring the dough characteristics of weak gluten wheats.
Weak gluten flour with low P
value (strength of gluten) and long L value (extensibility) is preferred for
cakes and other confectionery products. Strong gluten flour will have high P
values and is preferred for breads.
The Alveograph Test measures and records the force required to
blow and break a bubble of dough.
- P Value is the force required to blow the bubble of dough. It is indicated by the maximum height of the curve and is expressed in millimeters (mm).
- L Value is the extensibility of the dough before the bubble breaks. It is indicated by the length of the curve and is expressed in millimeters (mm).
- P/L Ratio is the balance between dough strength and extensibility.
- W Value is the area under the curve. It is a combination of dough strength (P value) and extensibility (L value) and is expressed in joules. Weak gluten flour has lower P values than strong gluten flour.
Mixograph
The mixograph determines dough and gluten properties of a flour by measuring
the resistance of a dough against the mixing action of pins. Mixograph results
include water absorption, peak time, and mixing tolerance. The mixograph curve indicates gluten strength, optimum
dough development time, mixing tolerance (tolerance to over-mixing), and other
dough characteristics. The amount of water added (absorption) affects the
position of the curve on the graph paper. Less water increases dough
consistency and moves the curve upward. Mixograph curves are described below :
 |
| Weak Gluten Flour |
 |
| Strong Gluten Flour |
The Mixograph Test measures and records the resistance of a
dough to mixing with pins.
- Peak Time is the dough development time, beginning the moment the mixer and the recorder are started and continuing until the dough reaches maximum consistency. This indicates optimum mixing time and is expressed in minutes.
- Mixing Tolerance is the resistance of the dough to breakdown during continued mixing and affects the shape of the curve. This indicates tolerance to overmixing and is expressed as a numerical score based
on comparison to a control. Weak gluten flour has a shorter peak time
and less mixing tolerance than strong gluten flour.
I had spent so much time for searching information on this topic. But, a small number of sites I have found. In those, this one helped me a lot. Thanks for sharing wonderful information. If you want to know more about this topic, then click on the below links.
ReplyDeleteThank You!
Trading
Future Market
international trade
US dollar
That's a great article and detail regarding the stocks. What are the habits of good investor? and how to pick a right investment option?
ReplyDeleteall types of stocks
Marico
best franklin templeton mutual fund
ujjivan financial services
analyst estimates
what is the stock market
mutual fund news
hindalco share price
Nice Article. Thank you for sharing the informative article with us.
ReplyDeleteThis post is helpful to many people. stockinvestor.in is a stock related website which provides all stocks related information like new stocks and shares available in the stock market.
petronet lng share price
havells india share price
Post a Comment