 |
| Survey Overview of Soft Red Winter |
Weather and Harvest: Soft
red winter wheat (SRW) is grown over a wide area of eastern United States. Thearea
seeded to SRW in fall 2016 for the 2017 harvest is estimated by USDA at 5.6
million acres (2.3 millionhectares), down from 6.6 million acres (2.7 million
hectares) seeded for the 2016 harvest and well below the five-year average SRW
planted area. The reduced area is attributed mainly to choices made by growers
based on commodity prices. The 2017 SRW production, estimated at 8.3 million
metric tons (MMT), is down from 9.4 MMT in 2016 and is well below the five-year
average. However, USDA estimates that the total SRW supply (excluding imports)
for the 2017/18 marketing year is 4% higher than 2016/17 because of higher
2017/18 beginning stocks.
Planting proceeded at a slightly slower than normal pace in fall 2016.
However, the crop was in good condition by late fall with more than 90% of
winter wheat rated fair to excellent in five of the six SRW survey states where
wheat crop conditions are reported by USDA. While some of the southeastern SRW
area was dry through the winter months, ample rain in March through early June
provided adequate moisture for crop development. The beginning of SRW harvest
was delayed somewhat by rain, but once started, harvest progressed rapidly.
Survey Methods: Sample
collection and analysis were conducted by the Great Plains Analytical
Laboratory, Kansas City, Missouri. In 2017, 270 samples were collected from
elevators in 18 reporting areas across eleven states. Alabama and Tennessee
were surveyed in 2017 for the first time. Test weight, moisture, protein, thousand
kernel weight, wheat ash and falling number were determined on all individual
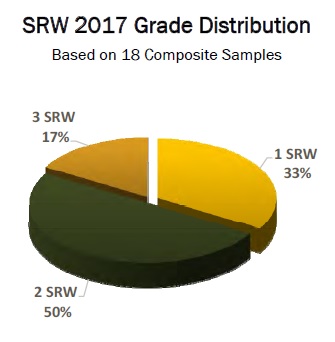
samples, and the remaining tests were determined on 18 composite samples. The
results were weighted by the estimated production for each reporting area and
combined into “Composite Average”, “East Coast” and “Gulf Port” values. Gulf
Port states include Alabama, Arkansas, Illinois, Indiana, Kentucky, Missouri,
Ohio, and Tennessee, and accounted for 79% of the 2017 SRW production in the
states surveyed. East Coast states include Maryland, North Carolina and
Virginia and represent the remaining 21% of production in the states surveyed. The
states surveyed account for an estimated 77% of total 2017 SRW production.
Wheat and Grade Data: When
analysis results are weighted by estimated state production, the average gradeof
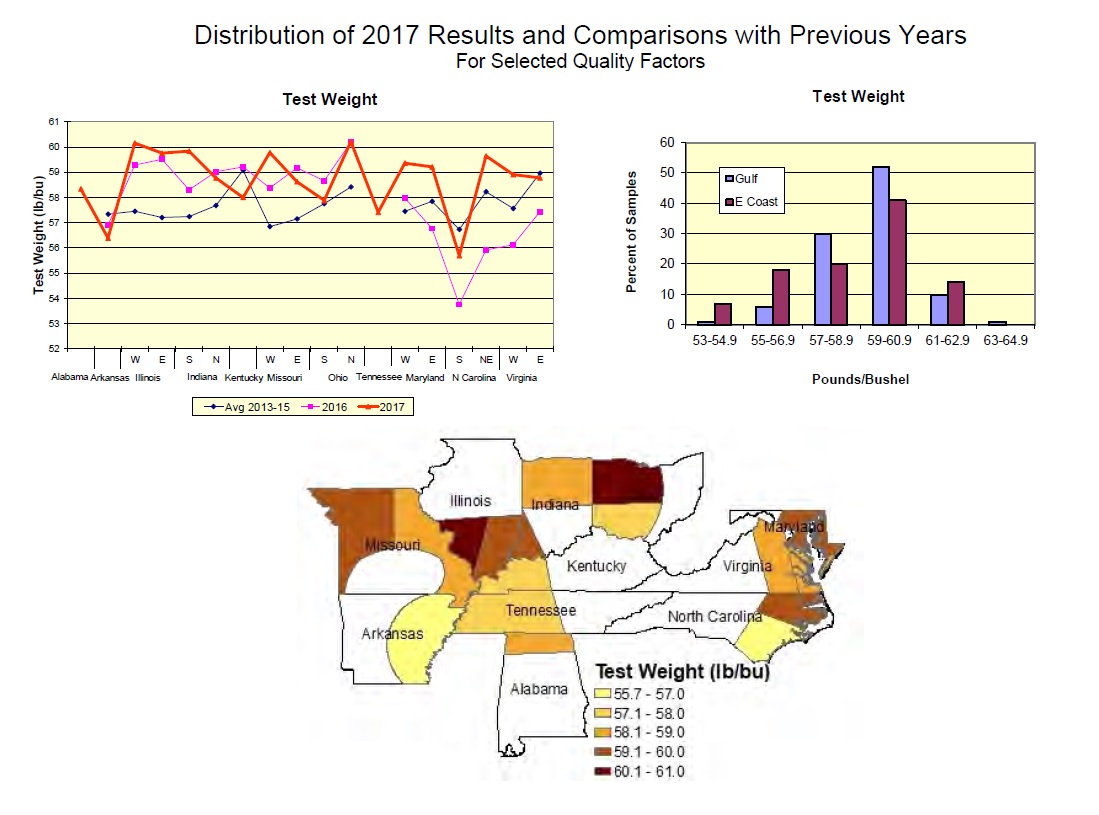
all samples collected for the 2017 SRW harvest survey is U.S. No. 2. The weighted
average test weight is 59.1 lb/bu, above the five-year average and the 58.6
lb/bu average of 2016. The Gulf Port average of 59.2lb/bu is similar to the
2016 average and above the five-year average of 58.6 lb/bu. The East Coast test
weight average of 58.6 lb/bu is above both last year and the five-year average.
The Gulf dockage value of 0.3% is lower than any recorded in the previous five
years. Other grade factors as well as moisture and dockage for both areas are
similar to or better than the five-year averages.
The Composite average wheat protein content of 9.5% (12% moisture
basis) is similar to last year and only
slightly below the five-year average of 9.8%. The 2017 East Coast and
Gulf Port protein averages are similar. However, the East Coast average protein
of 9.4% is below the region’s 2016 and five-year averages, while the Gulf Port
average of 9.5% is above the region’s 2016 average of 9.1% and slightly below
its five-year average of 9.7%. The Composite average falling number of 319
seconds is below 2016 but above the five-year average and indicates a generally
sound crop. Fewer than 20% of samples had a falling number below 300 seconds in
2017, and only 4 of 270 were below 250 seconds. The Composite DON average of
0.4 ppm is below the 2016 value of 0.6 ppm and well below the five-year average
of 1.3 ppm, indicating that the crop sampled is relatively free of DON. The
East Coast value of 0.8 ppm and the Gulf Port value of 0.3 ppm are both below
last year’s values and five-year averages.
Flour and Baking Data: The
Composite, East Coast and Gulf Port Buhler laboratory mill flour extraction averages
are above 2016 but below the five-year averages. The Composite farinograph peak
and absorption values are similar to five-year averages, but the stability
value of 2.2 min is slightly shorter than last year and the five-year average.
The Gulf Port peak and stability averages of 1.3 min and 2.4 min, respectively,
are similar to last year and the five-year averages, while the East Coast peak
and stability values of 1.2 min and 1.7 min are both shorter than last year and
the five-year averages. The Composite and Gulf Port alveograph W values of 92
and 93, respectively, are higher than the five-year averages of 80 and 79. The
other Composite, East Coast and Gulf Port alveograph values are all similar to
the respective five-year averages given the variability of alveograph analysis.
The Composite and Gulf Port cookie spread ratios are lower than last year and
the five-year averages. Average loaf volumes are all similar to last year and
the five-year averages.
Summary: Although reduced
planted area decreased 2017 SRW production, the crop had generally favorable growing
season and harvest conditions for both East Coast and Gulf Port states. Test
weight is well above average and dockage is below average. The entire crop in
the states sampled is largely free of sprout damage, and DON values are all
below last year and the five-year averages. Buyers are encouraged to review
their quality specifications to ensure that their purchases meet their
expectations.
This survey was funded by U.S.
Wheat Associates and USDA’s Foreign Agricultural Service.
About U.S. Wheat Associates: U.S.
Wheat Associates (USW) is the industry’s market development organization working
in more than 100 countries. Its mission is to “develop, maintain, and expand
international markets to enhance the profitability of U.S. wheat producers and
their customers.” USW activities are funded by producer checkoff dollars
managed by 17 state wheat commissions and through cost-share USDA Foreign
Agricultural Service market development programs. For more information, visit
www.uswheat.org or contact your state wheat commission.
Nondiscrimination and Alternate
Means of Communications: USW prohibits discrimination in all its programs and
activities on the basis of race, color, religion, national origin, gender,
marital or family status, age, disability, political beliefs or sexual
orientation. Persons with disabilities who require alternative means for communication
of program information (Braille, large print, audiotape, etc.) should contact
USW at 202-463- 0999 (TDD/TTY - 800-877-8339, or from outside the U.S.,
605-331-4923). To file a complaint of discrimination, write to Vice President
of Finance, USW, 3103 10th Street, North, Arlington, VA 22201, or call 202-463-0999.
USW is an equal opportunity provider and employer.


إرسال تعليق