1. U.S. Wheat Grades
Tab. 15 summarizes the grade requirements for wheat.
There are 5 wheat grades for good quality wheat. All other wheat, i.e.
wheat that
– does not meet the requirements for grades U.S. Numbers 1, 2, 3, 4 or
5; or
– has a musty, sour, or commercially objectionable foreign odour
(except smut or garlic odour); or
– is heating or otherwise of distinctly low quality, is classified
U.S. sample grade.
 |
Tab. 15: Grades and grade requirements for wheat
|
2. Milling Industry Overview
The U.S. Milling Industry has undergone dramatic change from any
perspective, both from a historical and a current business view. North American
milling is without question a competition- based market. It has been shaped and
moulded by the economic forces created by the combined decisions of the
consumers and producers of flour. In order to put these changes into a context
to which we can all relate, a set of terms common to the U.S. market will be
used to bring some clarity to this subject matter.
• Annual Wheat Flour
Production:
Total flour produced by all U.S. milling companies combined in one
calendar year. Expressed in Cwt 8.
• Daily Capacity:
The amount of flour capable of being produced by all U.S. mills in one
24-hour period. Expressed in Cwt (shown here in metric tonnes).
• Operating Rate:
A percentage calculated by dividing the "Annual Wheat Flour
Production" by the theoretical "Annual" 6-day capacity of the industry.
Expressed as a percentage
• Per Capita Consumption:
The amount in pounds of wheat flour consumed per person in the U.S.
This includes all forms of wheat-based food products and is calculated on a
disappearance basis. Expressed in lb per year.
Note :
8 1. A unit of
weight in the U.S. Customary System equal to 100 pounds (45.36 kg). Also called
cental, or short hundertweight.
2. A unit of weight in the
British Imperial System equal to 112 pounds (50.80 kg). Also called quintal.
Flour milling is clearly one of the world's oldest industries, for the
extraction of endosperm from wheat as a source of food was one of mankind's
first halting steps towards civilization. In America flour milling is among the
oldest industries; in fact the first flour mill was established in Virginia in
1621, or just 14 years after the settlement of Jamestown. In the 18th and 19th
centuries, as the U.S. grew and moved west, new flour mills were built as
virgin lands were cultivated and began producing large crops of wheat. As the
people moved west, so did the production of wheat and the milling of flour.
Towards the end of the nineteenth century, as wheat growing became established
in the Great Plains, the mills in that area tended to become larger, and those
plants remained in operation well after the westward migration of people
spilled over the Rocky Mountains onto the West Coast. Even as the westward
migration to California, Oregon and Washington of the nineteenth century turned
into the flood of the twentieth, two of the three largest wheat flour milling states
were in the heart of the traditional wheat growing region – Kansas, which ranks
number one and Minnesota, which is number three (California has recently
replaced New York as number two; Anon., 1998).
Not only is flour milling one of the oldest industries in the United
States; it has also been one of the largest industries. In fact in 1900 flour
milling was the largest industrial classification in the United States, with
some thousands of small, mostly privately owned mills. This is no longer the
case. Today the number of mills has dropped to less than 200, most of these being
large mills. The number of companies owning mills has compressed even more
dramatically. If we look at the current status of the U.S. milling industry we
see there are at least four trends of some significance. The first trend is the
reduction of companies currently milling wheat into flour in the U.S. (Tab.
16).
 |
Tab. 15: Grades and grade requirements for wheat
|
One of the clear effects of competition-based change is that there are
winners and losers. In U.S. milling, maybe "winner" doesn't describe the
existing milling companies as well as the term "survivor". As is true
in all business, we must look at a longer view to understand if a current
"survivor" is a true winner or simply the next market-place victim.
History is shouting that the number of milling companies in the United States is
in decline. Current economics seem to support a continuation of that decline. As
of this writing there are approximately 194 wheat flourmills operated by about
85 milling companies (Anon., 2000).
The second trend, which is tied to the first, is the reduction in the
number of operating mills in the United States (Tab. 16).
The message of Tab. 16 is that the U.S. demand for flour compared to
the available supply is limiting the financial return for milling companies. This
earnings pressure is causing milling companies interested in remaining in the
business to look for growth through acquisition. The goal of the acquisition is
to increase sales volume without increasing the corporate infrastructure
required to operate the company, thus allowing the remaining company to take
advantage of the increased scale through increased earnings. Tab. 16 also shows
the long-term change in the number of mills and in the average size of the
remaining mills since 1974. It is interesting to note that average mill size
has more than doubled while the number of milling locations has dropped to
slightly more than half. Again, it appears that in order to produce an
acceptable return for the company owners, a mill has had to increase the output
of a location in a greater proportion to its fixed cost structure. Much like a company has had to
add locations to increase its output in relation to its overall corporate size,
the individual mill has had to increase its output in relation to the fixed operating
costs of an individual location.
 |
Fig. 18: U.S. Mills by daily flour capacity and market share (Anon.,
2005)
|
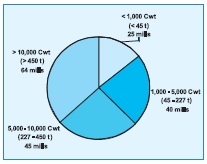 |
Fig. 19: Number of mills by daily flour capacity (Anon., 2005)
|
This third trend of increased mill size is understood better by
comparing Fig. 18 and Fig. 19. These charts further break down the number of
mills in operation and group them by overall size. While the average U.S. mill produces
just over 380 t of flour per day, the reality is that the largest number of
mills in the U.S. produces more than 450 t of flour per day. This further
highlights the fact that mills have had to get bigger to maintain or improve
their financial position. Finally, if we look at the amount of wheat ground by
all mills within a size distribution we can see that as expected the
largest mills also dominate the overall capacity of the country. In fact two thirds
of all wheat is ground by one third of the mills.
Mills and milling companies positioned well geographically and
strategically have survived to acquire those that have good geography but a
poor strategy. Those with neither good geography nor good strategies are
typically the mills abandoned.
The final trend is somewhat surprising. The U.S. industry has
continued to grow in overall daily capacity. While consolidation has taken out
numerous mills and milling companies, the opposite has happened with respect to
the ability of the industry to produce flour (Fig. 20). This chart shows that
there has been an upward trend in the capacity to produce flour in the U.S. for
the last 6 years of the last decade. While this has been an exciting time of
resurgence for the industry, the current condition is not one of widespread
optimism. Part of the issue has to do with the amount of capacity added in the
late 1990s. As many have said, the Western U.S. needed one new flour mill in 1999,
but 4 milling companies built it.
Some focus should be given to the U.S. wheat flour demand. Several
factors go together to create the overall demand for wheat flour in the United
States.
• Population
• Per Capita Consumption
• Dietary Perceptions
• Flour Use
 |
Fig. 20: U.S. milling output versus U.S. milling capacity 3
|
The demand for flour in the U.S comes from two major factors. The
first is the U.S. population and the second is per capita consumption of wheat
flour based products. Flour and wheat based imports, while important, have been
largely flat over time and have been ignored in this analysis. Exports of U.S.
flour have played an important role in the strength of the U.S.
generally overshadowed by governmental policies and therefore are not
a good indication of the U.S milling industry's world competitiveness. Exports,
too, have been ignored as a part of the demand for U.S. flour and flour based
products.
 |
Fig. 21: Change in population for U.S. states 1990 to 1999 (source:
U.S. Census Bureau)
|
The shift of population centres from North to South and East to West
has had the impact of shifting flour demand away from some of the North Eastern
and Midwestern mills towards mills able to send flour to the growing Western markets.
 |
Fig. 22: U.S. flour consumption per capita by year 3
|
Per capita consumption is equally critical to a growing U.S. industry.
Remember, in the U.S. we measure the amount of flour consumed in one year, not
the wheat. In so doing we exclude the amount of wheat eaten by animals. The growth
in per capita consumption of flour has been one of the real success stories in
the U.S. food industry. U.S. flour consumption has grown by nearly 25% since
1964, and has fuelled the need for much of the milling capacity expansion. This
growth in demand has come about due to a couple of factors. The primary reasons
were that a favourable perception that "grain is healthy" was
combined with an American population that began to eat on the go. Meaning that
the meal is consumed away from home, often in an automobile, making time and convenience
extremely important. This has dramatically increased the use of wheat flour products
used as "meal carriers". Buns for hamburgers and hot dogs; tortilla wraps
for hand-held meals and sheeted bread products like pizza dominated the
consumption growth of the last three decades. The "grain is healthy"
viewpoint was further enhanced by the government's adoption of the food guide pyramid
(page 28) that describes a healthy diet as being based upon foods made from
grain.
One area of concern is the apparent levelling of this growth trend
that appears to have taken place over the last couple of years (Fig. 22). Much
of the concern lies in the unknown. No one is sure, but the speculation is that
we may have reached a plateau of consumption in the U.S. Others more optimistic
see this not as a plateau but as a slowing of the growth rate. In either case,
the growth rate of domestic flour demand has slowed to near stagnation, equal
to just that growth that has come from the increased population and government
aid donations. This will continue to challenge the U.S. milling industry to
make many tough decisions about capacity. The likely scenario is one of
continued consolidation in the number of companies, and the abandonment of
misplaced less strategic capacity. The U.S. milling industry is believed to be
healthy economically when the industry operating rate exceeds 90%. Any
reduction in demand or increase in supply in the near term could push the industry
into another round of consolidation.
However, an end to the consolidation will come. Over time the remaining
milling companies and mills will be less likely to overbuild capacity and repeat
the cycle of oversupply and consolidation. This belief is based upon the
assumption that with fewer companies making "capacitybalancing decisions",
better decisions will result. These surviving companies, hurt economically in this
recent period of capacity expansion, will be less likely to trigger another
state of over capacity.
Post a Comment